

High resolution hydrodynamic surveys produce output data of such large quantity that many applications for engineering decisions are
being lost.
HyPAS is a tool designed to remediate that problem as well as improve current applications of such data.
HyPAS
- Imports data and maintains an organized database storing all of the resulting data from high resolution hydrodynamic surveys.
- Provides interactive visualization tools for engineers, scientists, and technical staff to maintain, analyze, query, manipulate, and display data without an extensive learning curve.
- Eliminates the need for numerous plots by allowing the engineer or scientist to perform the analysis graphically before finalizing in hard copy format.
HyPAS for ArcView currently provides three analysis tools for Velocity Data
- Contouring velocity data in planview.
- Plotting vector magnitude and direction in planview.
- Creating cross-sections of velocity data.
HyPAS for ArcView provides three additional analysis tools...
- Importing and displaying digital photography for project management enhancement
- Importing and Analyzing Time Series Data
- Importing and Analyzing Grain Size Soil Samples
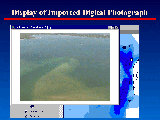 |
This image shows an Imported Digital Photograph. |
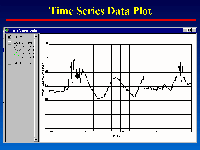 |
This image shows a Time Series Data Plot. |
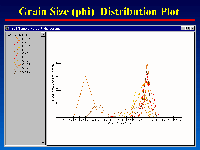 |
This image shows a GrainSize (phi) Distribution Plot. |
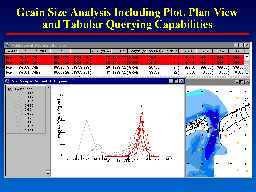 |
This image shows a Soil Sample Analysis by displaying selected samples in
Tabular, Histogram, and Plan View windows. |
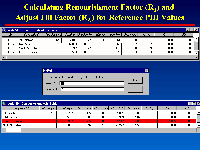 |
This image shows the capability to calculate the Adjust Fill and Renourishment
Factors with reference PHI values. |
Additional Analysis Routines...
- Overlaying Fish Tracking Data with ADCP Cross Sections
- Wave Frequency and Direction Analysis
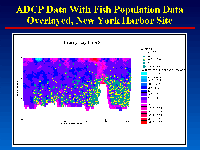 |
This image shows ADCP data with Fish Population Data overlaid. |
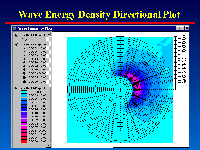 |
This image shows a Wave Energy Density Direction Plot. |
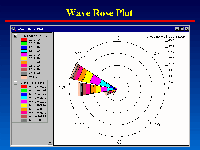 |
This image shows a Wave Rose Plot. |
Possible future enhancements to HyPAS may include...
- Complete conversion to PC-based ArcView GIS.
- Add functionality to convert acoustic backscatter intensity data from ADCP to sediment concentration data for analysis.
- Add additional importing/exporting capabilities.
- Add statistical analysis tools.
- Add math functions to allow for comparing multiple data types such as bathymetry, shoreline position, material properties, and any type of scalar quantity.
HyPAS Summary
- Provides the capability to maintain, display, analyze, query, manipulate, and display high resolution hydrodynamic Acoustic Doppler Current Profiler (ADCP) data, bathymetry, and any scalar data type.
- Importing/exporting capabilities to other software packages and file formats.
- It is a fully expandable toolbox for engineers and scientists to explore their data in order to make more informed decisions.
Points of Contact
Thad C. Pratt
CEWES-CE-TH
Waterways Experiment Station
3909 Halls Ferry Road
Vicksburg, MS 39180
Email:
Prattt@mail.wes.army.mil
Daryl S. Cook
CEWES-CE-TH
Waterways Experiment Station
3909 Halls Ferry Road
Vicksburg, MS 39180
Email:
daryl@wilma.wes.army.mil
 Return to Products and Tools
Last Updated October 13, 2000


 Return to Products and Tools